All about local taxation

What States have the Lowest Taxes?

In a prior blog Post on Insights, What State has the Lowest Cost of Living? – TownScoreReport, states were ranked based on total state-levied taxation. These rankings included all taxes and fees levied by the state and its agencies, such as income taxes, sales taxes, state-levied property taxes, excise taxes, property transfer taxes, estate taxes, and the numerous types of fees collected by states, for probate, car registrations and so forth. States were compared based on both (1) state-levied taxes and fees as a total dollar amount for the median-income household and (2) state-levied taxes and fees as a percent of the median household income, or “burden.”

That Post highlights the fact that, besides house prices, state-level taxation is the biggest driver of cost-of-living differences across states. However, even house prices themselves are not as big of a driver of differences in cost-of-living across states as one might think. So, if you are searching for the best places to live in the US, you must consider your location-based expenses, namely, state and local-levied taxes and fees because these make up the lion’s share of your annual expenditures.

First, even though house prices vary state by state, that expenditure item is largely under one’s control. Second, your home is a one-time purchase, so the impact of house prices on your wallet is immunized relative to inflation. In fact, your mortgage payment declines in real terms with inflation, so owning a home offers an inflation hedge. While all of this is good news, there is one aspect of your location-based expenditures that is impacted by inflation: the taxes associated with your location. Both your local and state taxes and fees have a huge impact on your total housing expenses, and the longer you own your home, the bigger the absolute and relative impact these taxes and fees have.

Upon closing, your housing expenses are roughly 1/3 mortgage payment, slightly more than 1/3 state-levied taxes and fees, and slightly less than 1/3 local taxes and fees. This means that your total housing expense is 2/3 taxes and fees, and only 1/3 mortgage, and again, that’s at the time of closing. Over time, your mortgage payment comprises a smaller amount of total expenditure, because this is fixed, whereas your taxes and fees rise over time. And unlike the price of the house you bought, which is largely under your control–since you chose it over other houses, your location-based taxes and fees, meaning all state and local taxes, are largely out of your control. You cannot fight city hall. Or the statehouse.

How local taxes impact your total expenditures does vary state by state and town by town, and this analysis is addressed elsewhere on TownScoreReport.com.

How do states compare in terms of the amount of state taxes and fees residents pay?

Below we show selected pairings of states. In the first table, we show how much the median household pays in one state, such as California, Connecticut, Illinois, Massachusetts, New Jersey, and New York and compare it to the amount paid in other states, such as Colorado, Florida, Georgia, Idaho, Nevada, New Hampshire, North Carolina, South Carolina, Tennessee, Texas and Vermont. The comparisons are based on the median household income in each state.

How Much More the Median Household Pays in all State-Levied Taxes and Fees


CALIFORNIA Residents Pay their State More than Residents in
COLORADO $3,925 more
IDAHO $4,922 more
NEVADA $7,721 more
TEXAS $5,112 more


CONNECTICUT Residents Pay their State More than Residents in
FLORIDA $6,200 more
GEORGIA $3,797 more
NEW HAMPSHIRE $5,836 more
TENNESSEE $5,100 more


ILLINOIS Residents Pay their State More than Residents in
GEORGIA $1,676 more
NORTH CAROLINA $321 more
TENNESSEE $2,979 more
TEXAS $2,396 more


MASSACHUSETTS Residents Pay their State More than Residents in
NEW HAMPSHIRE $9,834 more
FLORIDA $10,197 more
GEORGIA $7,794 more
TENNESSEE $9,098 more


NEW JERSEY Residents Pay their State More than Residents in
FLORIDA $7,173 more
GEORGIA $4,769 more
NORTH CAROLINA $3,415 more
TENNESSEE $6,073 more


NEW YORK Residents Pay their State More than Residents in
FLORIDA $9,981 more
GEORGIA $7,578 more
VERMONT $1,290 more
SOUTH CAROLINA $5,917 more

Source: Pality.

Next, we calculate how much the median household would save—or not save– from moving out of one state and into another, taking its income and assets along with it. For example, in the above tables, we show how much more the median household pays in Illinois versus how much the median household pays in Tennessee. In the tables below, we show how much the median household in Illinois would save annually if it picked up and moved to Texas. In this way, we can assess if you would really save money by moving from one of these “outbound” states to another, “inbound” state.


Savings by Moving from CALIFORNIA to
COLORADO $5,228 in savings
IDAHO $3,314 in savings
NEVADA $9,927 in savings
TEXAS $4,332 in savings


Savings by Moving from CONNECTICUT to
FLORIDA $5,310 in savings
GEORGIA -$2,226 (negative) savings
NEW HAMPSHIRE $6,492 in savings
TENNESSEE $113 in savings


Savings by Moving from ILLINOIS to
GEORGIA -$190 (negative) savings
NORTH CAROLINA -$3,409 (negative) savings
TENNESSEE $2,148 in savings
TEXAS $2,853 in savings


Savings by Moving from MASSACHUSETTS to
NEW HAMPSHIRE $5,593 in savings
FLORIDA $11,105 in savings
GEORGIA $3,569 in savings
TENNESSEE $5,907 in savings


Savings by Moving from NEW JERSEY to
FLORIDA $9,233 in savings
GEORGIA $1,697 in savings
NORTH CAROLINA -$1,522 (negative) savings
TENNESSEE $4,035 in savings


Savings from Moving from NEW YORK to
FLORIDA $15,689 in savings
GEORGIA $8,153 in savings
VERMONT -$5,945 (negative) savings
SOUTH CAROLINA $2,463 in savings


Some savings are not savings at all. Our analysis suggests that the median household would spend more by moving from Connecticut to Georgia, New York to Vermont, or from Illinois to North Carolina and from New Jersey to North Carolina. The differential would not be significant, for example, moving from Connecticut to Tennessee or Illinois to Georgia. The table reinforces what people are already observing and acting upon, namely that a California resident may save considerably from moving to Nevada, a Connecticut resident to Florida, an Illinois resident to Tennessee, a Massachusetts resident to New Hampshire, a New Jersey resident to Florida, and a New York resident to Georgia. The cost of living related to state-levied taxes and fees is available on State Score Reports for all 50 states on www.TownScoreReport.com.

Source: Pality. Copyright Pality 2024.

Buy Reports


By |2024-03-22T10:37:53-04:00February 19, 2024|Homeownership, Taxation|Comments Off on What States have the Lowest Taxes?

Tax fairness and free-ridership

Progressive or Regressive?

Tax fairness usually addresses whether tax burdens are progressive or regressive. With a progressive tax, the share of one’s income paid out as taxes rises as income rises, which is considered fair. With a regressive tax, the tax burden falls as income rises, which is considered unfair.

Generally, property tax is seen as progressive because high-income earners are more likely to own more expensive property and pay higher property taxes. Low-income earners are more likely to be renters, and depending on the strength of the rental market, landlords may not be able to pass through some of the property tax to their renters. Many cities and towns also have property tax exemptions for low-income households. Sales tax is thought to be the most regressive because not only does it tax the first dollar of spending, but it also burdens low-income earners disproportionally, who spend most of their income on basic needs. Income tax is progressive to the degree that the marginal tax rate rises with income, and the first dollars of income are tax-exempt.

Free-Ridership

Tax fairness also relates to who pays the taxes and who reaps the benefits of the services that the taxes fund. An imbalance between those who pay and those who benefit results in what is known as “free-ridership” or “free-riding.” Typically, this is a local taxation issue and is not identical to the concepts of redistribution or regressivity.

A city or town reliant on property taxes may have a free-ridership problem. Consider a city that has big box stores. These stores attract residents from surrounding communities who bring cars, which cause road wear and tear, as well as the need for traffic control, street lighting, garbage collection, police and ambulances, and other city services. But that city may be funded solely by the property taxes of the city’s residents. Although commercial establishments also pay property taxes, and their customers pay prices that capture the cost of taxation in turn, those taxes are not well aligned with the utilization of city-provided services. Further, not only do residents of larger cities and towns bear the tax burden, but they also absorb many negative externalities, such as noise pollution and reduced public safety from the transient population. Is it fair that residents of these cities pay for services used by “out-of-towners” who do not contribute to the cost?

Tax Burden and Population

Free-ridership may also be regressive. Not only do larger cities have more free-riders, but generally, tax burdens are also higher in larger cities. Using a broad sample of more than 100 cities with populations greater than 100,000, the correlation between the local tax burden, which is local taxes as a percent of income, and population size was observed to be 58%. So, unless there is a corrective cash redistribution from state funds to the local level, larger cities will continue to experience unfairness from free-ridership and potentially additional unfairness should their residents have fewer economic resources relative to out-of-towners.

Tax Burden and Population

Correlation coefficient = 58%.

Source: Pality.

Tax-Exempt Organizations

Tax-exempt property associated with non-profit institutions further compromises tax fairness. As an example, hospitals and universities, which are tax-exempt, invite free-ridership as they draw residents to utilize their services from well beyond the reach of a city’s taxing arm. Even when states provide relief through payments-in-lieu-of-taxes, these transfers rarely make the cities and towns whole from the foregone revenue associated with tax-exempt property. Yet again, the city’s residents must cover both direct costs, such as more traffic control, as well as indirect costs, such as noise pollution and reduced public safety. On top of this, they are shouldering the direct and indirect costs with fewer tax resources.

Can tax fairness be restored in cities and towns experiencing free-ridership?

If a state provides direct transfers of revenue from state-levied income and sales taxes to cities and towns experiencing free-ridership, fairness can be restored. However, if the state levies new taxes to fund these transfers, unintended consequences may arise, such as economic distortions and tax avoidance schemes. Further, once a tax is established, it is difficult to remove or reduce it. Finally, even if it is neutralized at the onset with a lower local property tax, the overall tax burden may creep up over time.

Written by Joseph Cahill.

Buy Reports

Copyright 2023 Pality.

By |2024-03-21T12:20:47-04:00November 3, 2023|Taxation|Comments Off on Tax fairness and free-ridership

Just how diversified are taxes?

What is Tax Diversification

Within the context of public finance, a government that is tax-diversified is one that levies a wide array of tax types. Tax diversification is a policy goal of many governments, as a lack of diversification may disproportionately burden certain groups of taxpayers or expose a government to economic shocks.

Facts versus Headlines

Governments, particularly state governments, are far more diversified than headline statistics suggest. Take New Hampshire, which has neither a sales tax nor a personal earned income tax. Is New Hampshire undiversified? The state government’s largest source of revenue is fees collected and revenue earned from governmental and business-type activities. These fees and revenue comprise 35% of total revenue, surpassing total tax revenue, which makes up only 27% of total revenue.

Now consider Florida, Texas, and South Dakota, three states with no personal income tax. Each state’s sales taxes comprise more than 80% of total tax revenue. When viewed alone, this might suggest that these states are undiversified, but in fact, tax revenue comprises less than one-third of their total revenue, like New Hampshire. All US state governments have not only a mixture of tax types but also a blend of additional revenue from business-type and component unit activities, as well as grants and transfers from federal and local governments.

Local governments are also more diversified than headline statistics suggest. Even a local government whose only source of tax revenue is property tax will collect fees and earn revenue from business-type and component unit activities, and may also receive transfers from the state, all of which are revenue diversifiers.

Tax Revenue Diversification

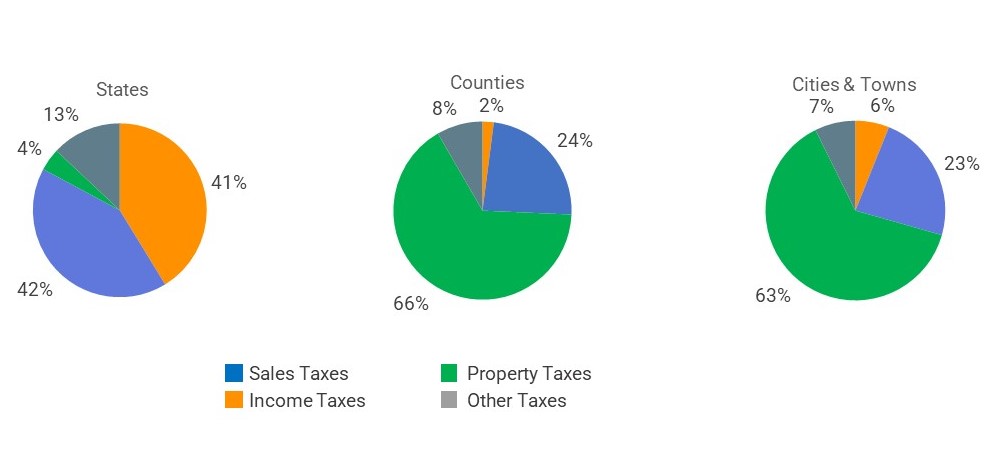
On average, a state’s income and sales taxes constitute 83% of total tax revenue. In counties, 66% of tax revenue comes from property taxes, 24% comes from sales taxes, 8% comes from other taxes, and income taxes contribute 2% to tax revenue. In cities and towns, 63% of tax revenue comes from property taxes, nearly 23% comes from sales taxes, and the remainder comes from income taxes and other taxes at 6% and 7%, respectively.

Source: Pality

Revenue Diversification

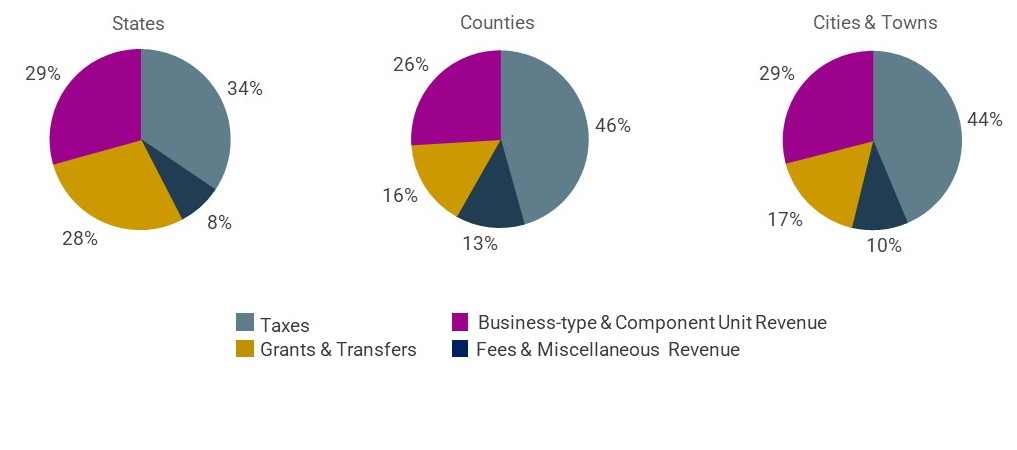
While each jurisdiction type has one or two predominant tax types, for all jurisdiction types, tax revenue comprises less than half of total revenue. In a typical state, tax revenue makes up 34% of total revenue. In a typical county, tax revenue comprises 46% of total revenue, and in a city or town, it makes up 44% of total revenue.

State governments, on average, earn a variety of fees and revenue from business-type and component unit activities. Together, these sources comprise 37% of total revenue, which is greater than the revenue that taxes contribute to total revenue. Transfers and grants, net of outflows to and inflows from cities, counties, and the federal government, make up the balance of about 28% of total revenue.

County governments earn a variety of fees and revenue from business-type and component unit activities as well, which together comprise 39% of total revenue on average. Transfers and grants, net of outflows and inflows, amount to 16% of total revenue.

The average revenue composition in cities and towns is like the revenue composition in counties, with a variety of government fees and revenue from business-type and component unit activities comprising 39% of total revenue and net transfers and grants comprising 17%.

Source: Pality

Tax Diversification for the Taxpayer

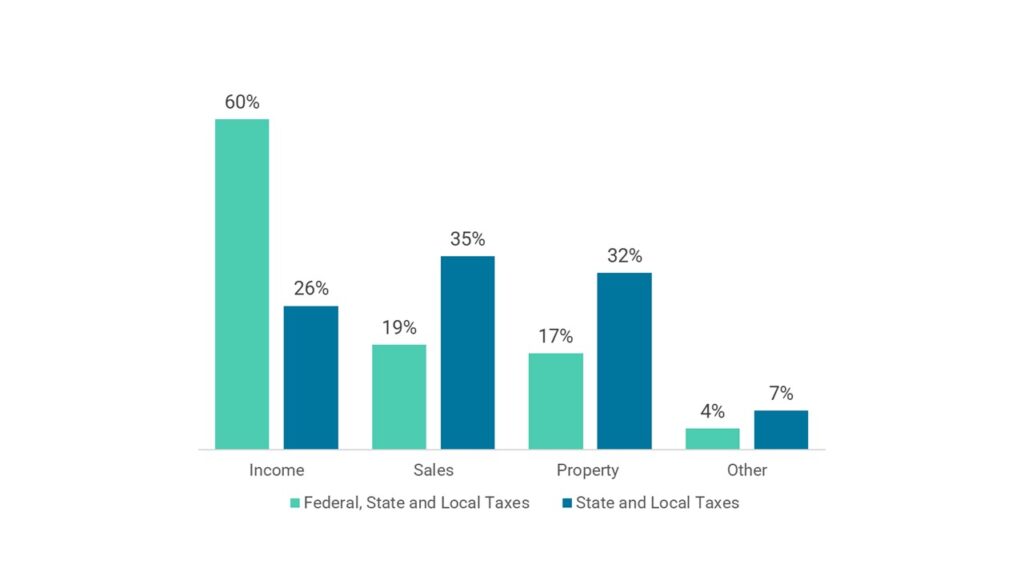
Even if a state or local government’s tax revenue composition is not well-diversified, a taxpayer’s tax burden is well-diversified when viewed in the aggregate. Excluding federal government taxes, the composition of the combined state and local tax burden on taxpayers is quite balanced on average, with sales taxes comprising 35%, property taxes comprising 32%, income taxes comprising 26%, and other taxes comprising 7% of total taxes paid.

If federal taxes are considered, income taxes play an even bigger role. Income taxes comprise 60% of all taxes collected by federal, state, and local governments, excluding payroll taxes. Combined across all jurisdictions, sales taxes comprise 19% of total tax revenue, property taxes comprise 17%, and other taxes account for 4%.

Share of Total Tax Revenue by Type of Tax

Source: Pality

Discussions surrounding tax diversification should address total revenue in addition to tax revenue and focus on diversifying the Tax & Fee Burden on taxpayers.

Written by James Galasso.

Buy Reports

Copyright 2023 Pality.

By |2024-03-21T12:18:26-04:00October 13, 2023|State and Local Finance, Taxation|Comments Off on Just how diversified are taxes?
Go to Top