All about assessing the state and local finances

In Connecticut and Massachusetts, Inflation Hits your Local Tax Bill

In the past ten years, more residents moved out of Connecticut and Massachusetts than moved in(1), due in part to high taxes and the prospect of higher taxes in the future. Connecticut experienced a dramatic uptick in migration outflow that peaked in 2019 and has since levelled off. Massachusetts’s outflow was less pronounced but peaked in 2021 and has since levelled off as well. The uptick in outflows were likely due to COVID, but now that COVID is behind us, what has happened to the taxes that caused so many to move away?

At Pality, publisher of TownScoreReport.com, we examine the change in local taxes paid by residents in Connecticut and Massachusetts from 2018 to 2023. This period covers the time from before COVID to after COVID. We capture all taxes and fees paid to local governments, such as property taxes, including those on cars and other personal property, special assessments, other taxes, fees and other government revenue derived from taxpayers.

We measure the change in taxes and fees in three ways: First, in dollars per household, and we compare this to inflation to observe whether the taxes increased in “real” terms, meaning on an inflation-adjusted basis.

Second, we measure “tax burden,” which is taxes and fees as a share of taxpayers’ income, to observe if local governments are taking more or less out of their taxpayers’ wallets.

And third, we measure taxes and fees as a percent of the market value of the median home in the city or town, which we call the “effective” property tax rate.

We aggregate the experience across households in the 169 cities and towns in Connecticut and across the 351 cities and towns in Massachusetts. The aggregation illuminates the local tax experience of the average taxpaying household in each state. Any given household’s experience can deviate significantly from the average. For example, one’s property assessment can rise more than average or one’s income can rise less than average, either of which will make the impact from taxation more severe than the averages presented here.

Which state had the largest increase in local taxes?

Percent Change in Local Taxes and Fees, Dollars per Household, 2018 to 2023:

Connecticut:  + 23.0%

Massachusetts:  + 27.8%.

From fiscal year 2018 to fiscal year 2023, households in Connecticut and Massachusetts saw significant increases in local taxes, rising 23% in Connecticut and 28% in Massachusetts. During this period, inflation was also at historical highs, with the price level increasing 21%. In “real” inflation-adjusted terms, local taxes and fees per household increased only slightly in Connecticut but nearly seven percent in Massachusetts. In both states, the absolute dollars paid per household rose considerably, outpacing the historically high inflation and compounding the impact of higher prices for everyday goods and services shouldered by households.

Which state had the largest increase in tax burden?

Percent Change in Local Taxes and Fees, Share of Household Wallet, 2018 to 2023:

Connecticut:  – 8.0%

Massachusetts:  – 10.3%.

While the total dollars that cities and towns collected from their residents increased in both states, in the aggregate and per household, average household incomes rose even faster during the period. In Connecticut, household income rose by 34% while taxes and fees flowing to the local governments grew somewhat less, by 23%. As a result by 2023, the local tax burden decreased by 8%. That is, local taxes and fees took 8% less out of the average Connecticut taxpayer’s wallet compared to 2018.

In Massachusetts, household incomes rose even faster over the five-year period, at 43%. This increase comfortably outpaced the 28% growth in local taxes and fees, resulting in local taxes and fees taking about 10% less out of the wallet of the average Massachusetts taxpayer than in 2018. Note that while incomes rose considerably in both Connecticut and Massachusetts, on an annualized basis, after adjusting for inflation, real household incomes rose in the two states by 2.1% and 3.5%, respectively.

Which state had the largest increase in the effective property tax rate?

Percent Change in Local Taxes and Fees, as Percent of Home Value, 2018 to 2023:

Connecticut:  – 11.0%

Massachusetts:  – 10.9%.

Since 2018, median house prices increased 38% in Connecticut and over 43% in Massachusetts, significantly outpacing inflation. Local taxes and fees, while also rising more than inflation, increased by less than home values. As of 2023 in both states, local taxes and fees represent a smaller percent of the market value of homes compared to 2018. This “effective” property tax rate fell by about 11% in both states.


Summary

In summary, the local tax experience for the average taxpayer in Connecticut and Massachusetts has been mixed.

In both states, the total amount of dollars paid to local governments increased by even more than the historically-high inflation, so in real terms, households now pay more. On top of higher prices for everyday goods and services, taxpayers also have to pay more to their local governments. Moreover, in both states, absolute dollars of local taxes and fees ought to have declined or at the very least, risen more slowly than they did given that schools represent the biggest component of local government spending in the two states. School enrollments fell by 3.9% in Connecticut and 3.6% in Massachusetts during the period, while the populations in each state rose by only 1.2% and 1.4%, respectively, notwithstanding net migration outflows.

And while local taxes and fees fell as a percent of average household income, taxpayers whose income growth did not keep pace with the average, such as retirees on fixed incomes, saw their burdens increase. Similarly, while home prices have increased faster than local taxes, a higher market valuation of one’s house does not pay the tax bill in either state. As for how local governments in Connecticut managed their tax impact compared to local governments in Massachusetts, the two states are at parity. Connecticut cities and towns performed less onerously than Massachusetts cities and towns because the absolute dollar amount of taxation rose by less. At the same time, tax burdens declined more in Massachusetts, but this was largely due to higher income growth, which is independent of the management of city or town, at least in the short run.

(1) https://www.unitedvanlines.com/newsroom/movers-study-2023.

Source: Pality, other than what is noted above. Copyright, Pality, 2025.

By |2025-01-02T17:20:13-05:00December 31, 2024|Homeownership, State and Local Finance, Taxation|Comments Off on In Connecticut and Massachusetts, Inflation Hits your Local Tax Bill

What State has the Lowest Cost of Living?

The Best Way to Measure the Cost of Living Differences among States is not the CPI

How can you make a true comparison of the cost of living across states? What states have the lowest cost of living? The government publishes the Consumer Price Index (CPI), which is used to measure inflation, and the Personal Consumption Expenditure index (PCE), which is also primarily an inflation measure, as well as a tool to compare the cost of living differentials across states and regions. They both capture your biggest expenses, such as housing, utilities, food, fuel, insurance, clothing, and sales taxes. These indices have their uses, but they are mainly used as composite measures made up of many components to gauge how prices change over time. Changes in their individual cost drivers are not well publicized and are hard to observe.

You Cannot Control Taxation

The biggest shortcoming of these indices is that they do not easily capture how your own out of pocket expenses are likely to be impacted if you move from one state to another. The cost of house, or rent, is a big expense item, yet it is under your control to a large extent. You may want to downsize or upsize. You can choose your house, as you can choose whether to go out to eat or what clothes to buy. What you cannot choose or control, is your taxation. And it is one of your biggest expenditures. Both the CPI and CPE indices are constructed from representative samples of baskets of goods, so you cannot really get a true picture of how your own cost of living is or would be impacted by state-level taxation. In fact, it is state-level taxes and fees which effectively are the biggest drivers of cost of living differences across states, and yet, these are hard to observe.

Taxation Lacks Transparency

Cost transparency for both state and local taxation is lacking, in contrast to on-line purchases or house prices. For most people, housing is perfectly understandable—you own a house and pay a mortgage, or you are shopping for a house and know the price. If you rent, you know how much you pay, and if you are looking to move, rental prices are discoverable. Many of your purchases come from global markets, where prices—pre shipping and pre-tax, are generally equalized. Therefore, price differentials of the goods that people buy do not have wide variation across the continental US.

The biggest driver of how the cost of living varies by state is state-level taxation.

Is the cost of living in Florida less than New York? Many people have already made the move to what they hope are lower-cost states, such as from New York to Florida, Connecticut to South Carolina, or Illinois to Tennessee. Did their taxes and fees really go down? If you are thinking about moving, understanding your true exposure to state taxation and how that impacts your cost of living is important information to have.

Why an Income Tax Rate or Sales Tax Rate is Not Enough Information

As most people know, not all states tax income and not all states tax sales. But those are broad statements. States that have “no income tax” may tax passively earned income. States with “no sales taxes” may tax many high-value items that you purchase, such as fuel, insurance, or alcohol. And states levy taxes on a variety of assets and activities in addition to income and sales taxes, such as estate taxes, vehicles, utilities, fuel, insurance, property transfers, even property itself. Yes, New Hampshire is a low-tax state with no tax on earned income and no taxes on most sales. But New Hampshire has to get revenue from somewhere, for example property taxes (state-levied), excise taxes, fees, sales taxes on certain items, and running businesses. Florida is a low tax-state, but it too must collect revenue from somewhere.

Therefore, it’s not enough to compare sales tax rates across states because of exemptions, tax holidays, special categories, and other carve-outs for items such as food purchased from the grocery store and clothing up to a certain dollar amount. The same challenges hold for state income taxes. Income tax rates vary across states, rates can be graduated, and normally do not kick in until an income threshold is surpassed. And certain types of income may still be taxed in “no income tax states,” such as passive income.

And then there are fees paid to states for car registrations, property transfers, probate, road usage, and more. These fees need to be factored into each state’s cost of living.

Taxes and fees should be compared both on a total dollar basis and as a percent of the income of residents. Ohio and Pennsylvania may have similar costs in dollar terms, but residents’ incomes in Pennsylvania are higher than in Ohio, which makes Pennsylvania more affordable on a relative basis.

Our approach is to capture all taxes and fees collected by a state and its state agencies from a state’s residents. This approach is the most comprehensive way to understand what the true burden is of living in a particular state. Consider a state’s budget process, which generally has the following pattern: First, the state government forecasts its expenditure needs. Second, it forecasts the revenue it expects to collect. Third, it measures if there is a funding gap. Fourth, if there is a gap, decisions are made as to how the gap should be filled, whether with higher taxes or fees, new taxes or fees, spending cuts, borrowing, or some combination of these options. If a new tax is created to fill the gap, for example, an excise tax on a new category, this does not show up in a sales tax “rate.”

We measure and compare state-levied taxes and fees across states, with all taxes and fees thrown into the “tax and fee bucket.” We rank states, measured as a percent of the fully-loaded state taxes and fees paid by households relative to household income, and as an absolute dollar cost per household. In the ranking, a “1” is the best, meaning lowest burden or lowest absolute dollar cost, and “50 is the worst. The state with the lowest state-levied tax and fee burden on households is Missouri, and the state with the highest state-levied tax and fee burden on households is New Mexico. Note that we exclude Washington, D.C., because it combines features of both a state and municipality, and for all other states, we are capturing taxes and fees levied only by states and state agencies.

State Rankings based on Taxation

The table below confirms that you will save significantly in taxes by moving from, for example, California to Idaho, Connecticut to Florida, or Illinois to Tennessee. From a state-tax perspective, yes, Florida is better than both Connecticut and New York, as is Tennessee. And Florida is still better than Tennessee, and Tennessee is still better than Idaho. But what about moving from Massachusetts to North Carolina? Here, the benefit of moving south is not so clear. For comparisons of selected states, in terms of total state-levied taxes and fees as well as how much you’d save by moving, see our Insights Post What States have the Lowest Taxes? – TownScoreReport.

In summary, having easy access to information about one of the biggest expenditure items of your life which you cannot control, is vital. More information on the cost of living across states, on state-taxation, and which states offer the best value for residents can be found in a State Score Report, available at www.TownScoreReport.com. Note that the State Score Reports are updated periodically, so for the most recent information, check www.TownScoreReport.com.

State and State Agency Taxes and Fees are the Biggest Drivers of Cost of Living differences in States.

Cost of Living Rankings, by State and State Agency Taxes and Fees. “1” is Best/Lowest.  

ALABAMA 39 ALABAMA 22
ALASKA 16 ALASKA 17
ARIZONA 9 ARIZONA 44
ARKANSAS 35 ARKANSAS 18
CALIFORNIA 29 CALIFORNIA 46
COLORADO 6 COLORADO 11
CONNECTICUT 15 CONNECTICUT 35
DELAWARE 20 DELAWARE 19
FLORIDA 3 FLORIDA 3
GEORGIA 17 GEORGIA 12
HAWAII 50 HAWAII 41
IDAHO 19 IDAHO 15
ILLINOIS 21 ILLINOIS 45
INDIANA 26 INDIANA 13
IOWA 38 IOWA 47
KANSAS 25 KANSAS 21
KENTUCKY 45 KENTUCKY 32
LOUISIANA 33 LOUISIANA 14
MAINE 31 MAINE 20
MARYLAND 22 MARYLAND 31
MASSACHUSETTS 28 MASSACHUSETTS 39
MICHIGAN 13 MICHIGAN 10
MINNESOTA 37 MINNESOTA 34
MISSISSIPPI 44 MISSISSIPPI 49
MISSOURI 5 MISSOURI 1
MONTANA 24 MONTANA 16
NEBRASKA 7 NEBRASKA 5
NEVADA 2 NEVADA 43
NEW HAMPSHIRE 1 NEW HAMPSHIRE 2
NEW JERSEY 30 NEW JERSEY 36
NEW MEXICO 49 NEW MEXICO 50
NEW YORK 43 NEW YORK 40
NORTH CAROLINA 32 NORTH CAROLINA 24
NORTH DAKOTA 48 NORTH DAKOTA 42
OHIO 12 OHIO 6
OKLAHOMA 40 OKLAHOMA 48
OREGON 34 OREGON 30
PENNSYLVANIA 8 PENNSYLVANIA 8
RHODE ISLAND 36 RHODE ISLAND 29
SOUTH CAROLINA 41 SOUTH CAROLINA 27
SOUTH DAKOTA 4 SOUTH DAKOTA 4
TENNESSEE 14 TENNESSEE 9
TEXAS 11 TEXAS 7
UTAH 42 UTAH 37
VERMONT 47 VERMONT 38
VIRGINIA 18 VIRGINIA 26
WASHINGTON 10 WASHINGTON 25
WEST VIRGINIA 46 WEST VIRGINIA 28
WISCONSIN 27 WISCONSIN 23
WYOMING 23 WYOMING 33

Source: Pality.

Copyright Pality 2024.

Buy Reports

By |2024-04-29T09:18:35-04:00February 15, 2024|Homeownership, State and Local Finance, TownScoreReport|Comments Off on What State has the Lowest Cost of Living?

What the general fund does not measure

The General Fund of a town, county, or state is often viewed as a measure of fiscal health. Is it positive or negative? Large or small? Growing or shrinking? The balance, size, and trend of the General Fund are all good statistics to examine, but when considered alone, the General Fund is not an adequate measure of a government’s fiscal health.

Liquidity

The General Fund reflects short-term liquidity. The General Fund balance is like your checking account balance. There may be cash in your account, but this says nothing about your net worth, which is calculated as your total assets minus your total liabilities. How much have you saved for your child’s college education or for your retirement, and do you have equity in your house? These are your assets. Do you have liabilities such as a mortgage, a car loan, or credit card debt? Many of us have experienced having money in our bank accounts despite having high credit card debt, minimal home equity, or insufficient savings for college or retirement.

Solvency

The General Fund does not answer the question, “How fiscally secure or solvent is my town, county, or state?” because the General Fund does not capture long-term liabilities. The questions that the General Fund answers are, “Can my government pay its bills that are coming due in the short term?” and “Is there cash for a ‘rainy day’?”

If a state or local government is not fiscally secure, it must raise taxes, cut spending, issue debt, reduce contributions to its retirement obligations, or some combination of these options. These decisions will directly affect many constituents, including taxpayers, employees, vendors, bondholders, and public sector retirees, both current and future.

Unrestricted Net Position and Solvency

If the question is, “Is your state or local government fiscally secure enough such that your taxes are less likely to be raised to amortize your government’s liabilities?”, the answer lies in the Unrestricted Net Position. The Unrestricted Net Position is a balance that reflects whether the government has sufficient assets to meet all liabilities without resorting to liquidating building and land assets or dipping into special-purpose funds.

The General Fund is not correlated with Solvency

Not only is the General Fund balance not an indicator of fiscal health, but it is also not positively correlated with the Unrestricted Net Position balance. In fact, the statistical correlation between these two balances is negative 29%.(1)

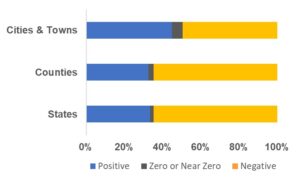
Just how fiscally secure are state and local governments? Only 33% of all states, 33% of sampled counties, and 45% of sampled towns (cities) have a positive Unrestricted Net Position. Sixty-five percent of states, 65% of sampled counties, and 50% of sampled towns (cities) have a negative Unrestricted Net Position. The remaining states, counties, and towns have an Unrestricted Net Position of zero or near zero.

Unrestricted Net Position of Cities & Towns, Counties, and States, FY 2021.

Buy Reports

(1) Includes any government “rainy day fund” balance, which may be a distinct reporting category. If “rainy day funds” were excluded from the data used for the calculation, the statistical correlation would be more negative.

Source Pality.

Written by James Galasso.

Copyright 2023 Pality.

By |2024-03-21T12:23:59-04:00November 5, 2023|State and Local Finance|Comments Off on What the general fund does not measure

Just how diversified are taxes?

What is Tax Diversification

Within the context of public finance, a government that is tax-diversified is one that levies a wide array of tax types. Tax diversification is a policy goal of many governments, as a lack of diversification may disproportionately burden certain groups of taxpayers or expose a government to economic shocks.

Facts versus Headlines

Governments, particularly state governments, are far more diversified than headline statistics suggest. Take New Hampshire, which has neither a sales tax nor a personal earned income tax. Is New Hampshire undiversified? The state government’s largest source of revenue is fees collected and revenue earned from governmental and business-type activities. These fees and revenue comprise 35% of total revenue, surpassing total tax revenue, which makes up only 27% of total revenue.

Now consider Florida, Texas, and South Dakota, three states with no personal income tax. Each state’s sales taxes comprise more than 80% of total tax revenue. When viewed alone, this might suggest that these states are undiversified, but in fact, tax revenue comprises less than one-third of their total revenue, like New Hampshire. All US state governments have not only a mixture of tax types but also a blend of additional revenue from business-type and component unit activities, as well as grants and transfers from federal and local governments.

Local governments are also more diversified than headline statistics suggest. Even a local government whose only source of tax revenue is property tax will collect fees and earn revenue from business-type and component unit activities, and may also receive transfers from the state, all of which are revenue diversifiers.

Tax Revenue Diversification

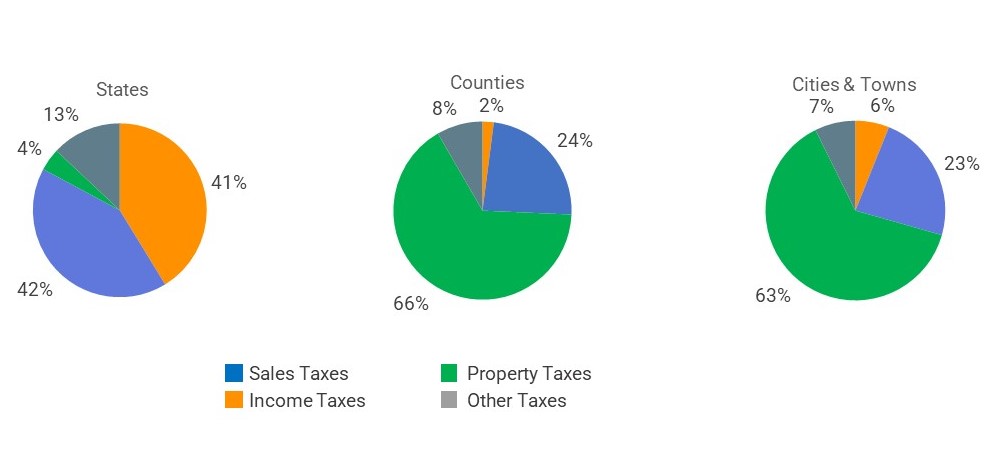
On average, a state’s income and sales taxes constitute 83% of total tax revenue. In counties, 66% of tax revenue comes from property taxes, 24% comes from sales taxes, 8% comes from other taxes, and income taxes contribute 2% to tax revenue. In cities and towns, 63% of tax revenue comes from property taxes, nearly 23% comes from sales taxes, and the remainder comes from income taxes and other taxes at 6% and 7%, respectively.

Source: Pality

Revenue Diversification

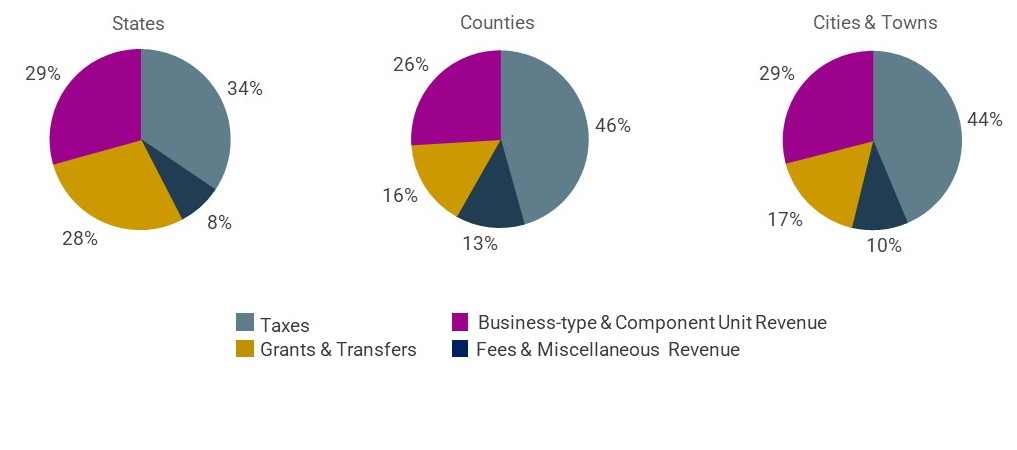
While each jurisdiction type has one or two predominant tax types, for all jurisdiction types, tax revenue comprises less than half of total revenue. In a typical state, tax revenue makes up 34% of total revenue. In a typical county, tax revenue comprises 46% of total revenue, and in a city or town, it makes up 44% of total revenue.

State governments, on average, earn a variety of fees and revenue from business-type and component unit activities. Together, these sources comprise 37% of total revenue, which is greater than the revenue that taxes contribute to total revenue. Transfers and grants, net of outflows to and inflows from cities, counties, and the federal government, make up the balance of about 28% of total revenue.

County governments earn a variety of fees and revenue from business-type and component unit activities as well, which together comprise 39% of total revenue on average. Transfers and grants, net of outflows and inflows, amount to 16% of total revenue.

The average revenue composition in cities and towns is like the revenue composition in counties, with a variety of government fees and revenue from business-type and component unit activities comprising 39% of total revenue and net transfers and grants comprising 17%.

Source: Pality

Tax Diversification for the Taxpayer

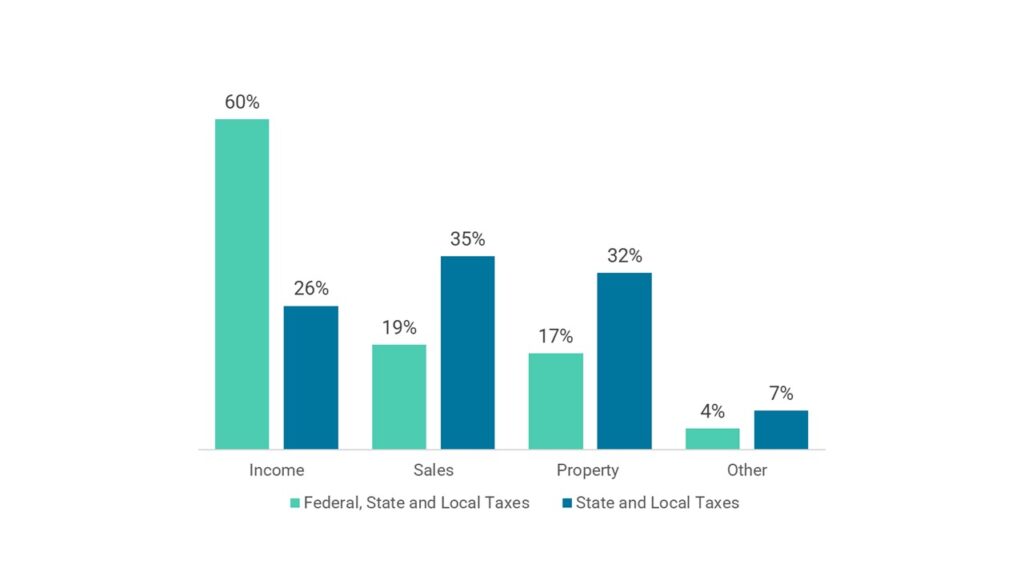
Even if a state or local government’s tax revenue composition is not well-diversified, a taxpayer’s tax burden is well-diversified when viewed in the aggregate. Excluding federal government taxes, the composition of the combined state and local tax burden on taxpayers is quite balanced on average, with sales taxes comprising 35%, property taxes comprising 32%, income taxes comprising 26%, and other taxes comprising 7% of total taxes paid.

If federal taxes are considered, income taxes play an even bigger role. Income taxes comprise 60% of all taxes collected by federal, state, and local governments, excluding payroll taxes. Combined across all jurisdictions, sales taxes comprise 19% of total tax revenue, property taxes comprise 17%, and other taxes account for 4%.

Share of Total Tax Revenue by Type of Tax

Source: Pality

Discussions surrounding tax diversification should address total revenue in addition to tax revenue and focus on diversifying the Tax & Fee Burden on taxpayers.

Written by James Galasso.

Buy Reports

Copyright 2023 Pality.

By |2024-03-21T12:18:26-04:00October 13, 2023|State and Local Finance, Taxation|Comments Off on Just how diversified are taxes?
Go to Top