About James Galasso

James Galasso is a data engineer specializing in public finance. His areas of expertise include the application of machine learning to the complexities in public finance reporting and in the design of data structures and data architecture. James holds a B.A. in Politics and Economics from Franklin & Marshall where he became interested in public finance.

What the general fund does not measure

The General Fund of a town, county, or state is often viewed as a measure of fiscal health. Is it positive or negative? Large or small? Growing or shrinking? The balance, size, and trend of the General Fund are all good statistics to examine, but when considered alone, the General Fund is not an adequate measure of a government’s fiscal health.

Liquidity

The General Fund reflects short-term liquidity. The General Fund balance is like your checking account balance. There may be cash in your account, but this says nothing about your net worth, which is calculated as your total assets minus your total liabilities. How much have you saved for your child’s college education or for your retirement, and do you have equity in your house? These are your assets. Do you have liabilities such as a mortgage, a car loan, or credit card debt? Many of us have experienced having money in our bank accounts despite having high credit card debt, minimal home equity, or insufficient savings for college or retirement.

Solvency

The General Fund does not answer the question, “How fiscally secure or solvent is my town, county, or state?” because the General Fund does not capture long-term liabilities. The questions that the General Fund answers are, “Can my government pay its bills that are coming due in the short term?” and “Is there cash for a ‘rainy day’?”

If a state or local government is not fiscally secure, it must raise taxes, cut spending, issue debt, reduce contributions to its retirement obligations, or some combination of these options. These decisions will directly affect many constituents, including taxpayers, employees, vendors, bondholders, and public sector retirees, both current and future.

Unrestricted Net Position and Solvency

If the question is, “Is your state or local government fiscally secure enough such that your taxes are less likely to be raised to amortize your government’s liabilities?”, the answer lies in the Unrestricted Net Position. The Unrestricted Net Position is a balance that reflects whether the government has sufficient assets to meet all liabilities without resorting to liquidating building and land assets or dipping into special-purpose funds.

The General Fund is not correlated with Solvency

Not only is the General Fund balance not an indicator of fiscal health, but it is also not positively correlated with the Unrestricted Net Position balance. In fact, the statistical correlation between these two balances is negative 29%.(1)

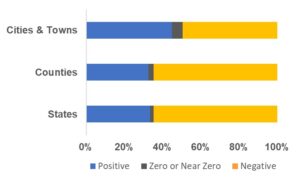
Just how fiscally secure are state and local governments? Only 33% of all states, 33% of sampled counties, and 45% of sampled towns (cities) have a positive Unrestricted Net Position. Sixty-five percent of states, 65% of sampled counties, and 50% of sampled towns (cities) have a negative Unrestricted Net Position. The remaining states, counties, and towns have an Unrestricted Net Position of zero or near zero.

Unrestricted Net Position of Cities & Towns, Counties, and States, FY 2021.
Buy Reports

(1) Includes any government “rainy day fund” balance, which may be a distinct reporting category. If “rainy day funds” were excluded from the data used for the calculation, the statistical correlation would be more negative.

Source Pality.

Written by James Galasso.

Copyright 2023 Pality.

By |2024-03-21T12:23:59-04:00November 5, 2023|State and Local Finance|Comments Off on What the general fund does not measure

Just how diversified are taxes?

What is Tax Diversification

Within the context of public finance, a government that is tax-diversified is one that levies a wide array of tax types. Tax diversification is a policy goal of many governments, as a lack of diversification may disproportionately burden certain groups of taxpayers or expose a government to economic shocks.

Facts versus Headlines

Governments, particularly state governments, are far more diversified than headline statistics suggest. Take New Hampshire, which has neither a sales tax nor a personal earned income tax. Is New Hampshire undiversified? The state government’s largest source of revenue is fees collected and revenue earned from governmental and business-type activities. These fees and revenue comprise 35% of total revenue, surpassing total tax revenue, which makes up only 27% of total revenue.

Now consider Florida, Texas, and South Dakota, three states with no personal income tax. Each state’s sales taxes comprise more than 80% of total tax revenue. When viewed alone, this might suggest that these states are undiversified, but in fact, tax revenue comprises less than one-third of their total revenue, like New Hampshire. All US state governments have not only a mixture of tax types but also a blend of additional revenue from business-type and component unit activities, as well as grants and transfers from federal and local governments.

Local governments are also more diversified than headline statistics suggest. Even a local government whose only source of tax revenue is property tax will collect fees and earn revenue from business-type and component unit activities, and may also receive transfers from the state, all of which are revenue diversifiers.

Tax Revenue Diversification

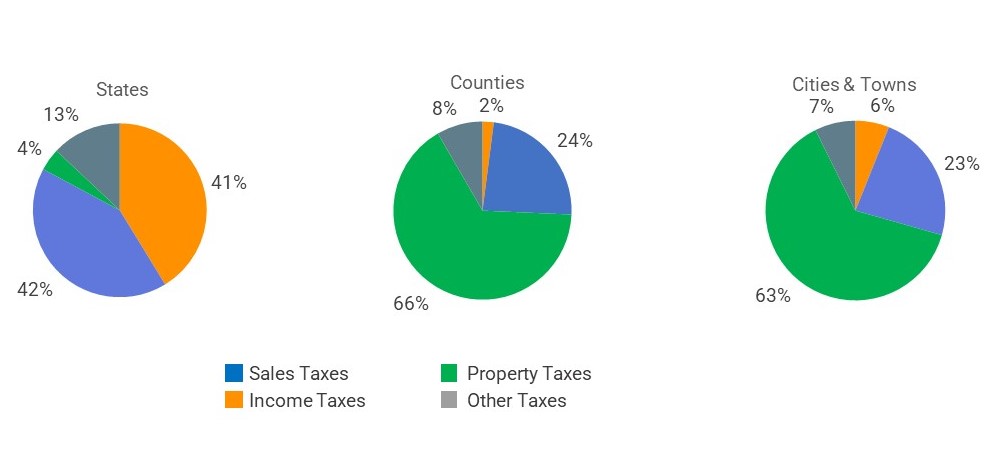
On average, a state’s income and sales taxes constitute 83% of total tax revenue. In counties, 66% of tax revenue comes from property taxes, 24% comes from sales taxes, 8% comes from other taxes, and income taxes contribute 2% to tax revenue. In cities and towns, 63% of tax revenue comes from property taxes, nearly 23% comes from sales taxes, and the remainder comes from income taxes and other taxes at 6% and 7%, respectively.

Source: Pality

Revenue Diversification

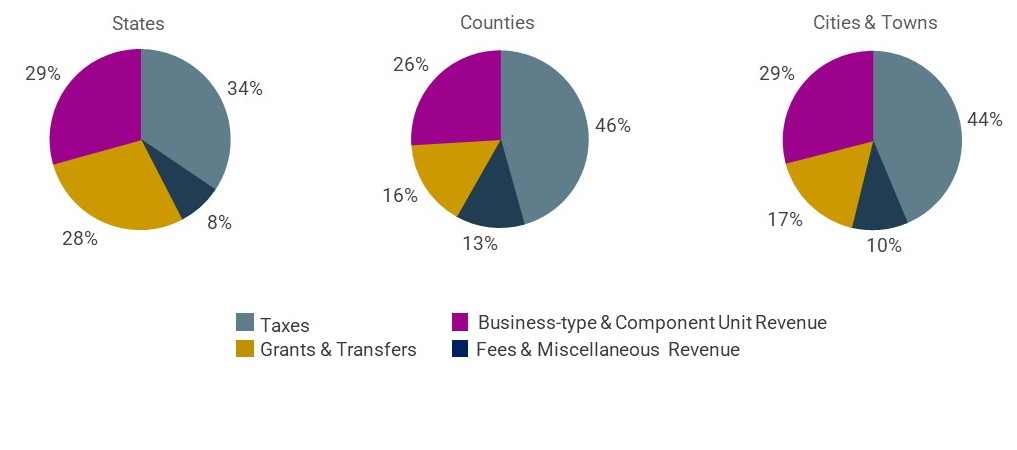
While each jurisdiction type has one or two predominant tax types, for all jurisdiction types, tax revenue comprises less than half of total revenue. In a typical state, tax revenue makes up 34% of total revenue. In a typical county, tax revenue comprises 46% of total revenue, and in a city or town, it makes up 44% of total revenue.

State governments, on average, earn a variety of fees and revenue from business-type and component unit activities. Together, these sources comprise 37% of total revenue, which is greater than the revenue that taxes contribute to total revenue. Transfers and grants, net of outflows to and inflows from cities, counties, and the federal government, make up the balance of about 28% of total revenue.

County governments earn a variety of fees and revenue from business-type and component unit activities as well, which together comprise 39% of total revenue on average. Transfers and grants, net of outflows and inflows, amount to 16% of total revenue.

The average revenue composition in cities and towns is like the revenue composition in counties, with a variety of government fees and revenue from business-type and component unit activities comprising 39% of total revenue and net transfers and grants comprising 17%.

Source: Pality

Tax Diversification for the Taxpayer

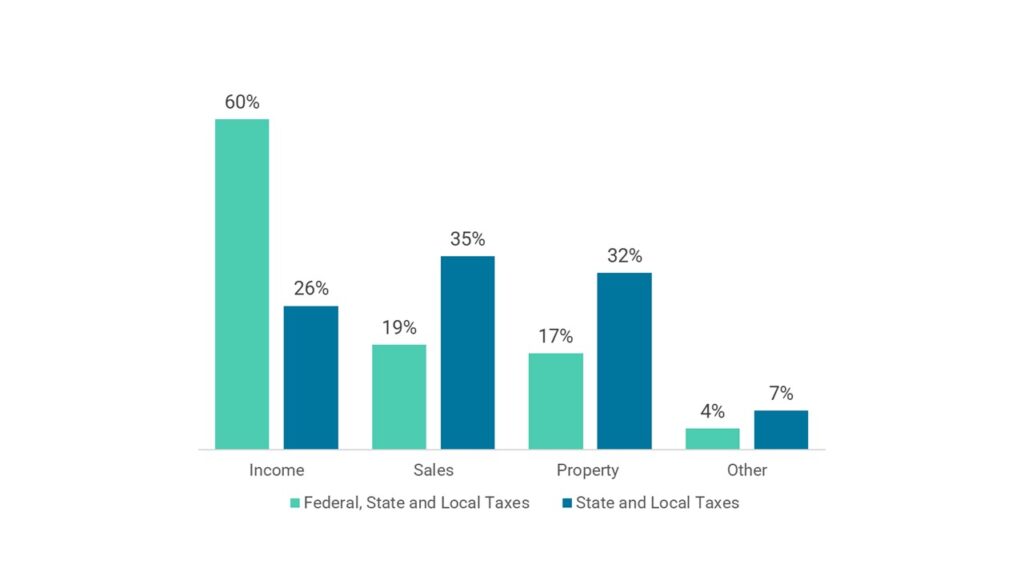
Even if a state or local government’s tax revenue composition is not well-diversified, a taxpayer’s tax burden is well-diversified when viewed in the aggregate. Excluding federal government taxes, the composition of the combined state and local tax burden on taxpayers is quite balanced on average, with sales taxes comprising 35%, property taxes comprising 32%, income taxes comprising 26%, and other taxes comprising 7% of total taxes paid.

If federal taxes are considered, income taxes play an even bigger role. Income taxes comprise 60% of all taxes collected by federal, state, and local governments, excluding payroll taxes. Combined across all jurisdictions, sales taxes comprise 19% of total tax revenue, property taxes comprise 17%, and other taxes account for 4%.

Share of Total Tax Revenue by Type of Tax

Source: Pality

Discussions surrounding tax diversification should address total revenue in addition to tax revenue and focus on diversifying the Tax & Fee Burden on taxpayers.

Written by James Galasso.

Buy Reports

Copyright 2023 Pality.

By |2024-03-21T12:18:26-04:00October 13, 2023|State and Local Finance, Taxation|Comments Off on Just how diversified are taxes?
Go to Top